Analysing MNIST image dataset using Scarf#
%load_ext autotime

import scarf
import matplotlib.pyplot as plt
import pandas as pd
scarf.__version__
'0.23.5'
time: 2.4 s (started: 2023-05-24 14:40:38 +00:00)
1) Fetch MNIST dataset and convert to Zarr format#
The MNIST datasets consists of 60K grayscale images (28x28 pixel) of handwritten digits (0 through 9). These can be unraveled such that each digit is described by a 784 dimensional vector. This dataset is available to download through Scarf. We saved this data in the same format as the output of cellranger pipeline with the matrix saved in MTX format.
scarf.fetch_dataset('lecun_60K_mnist_images', save_path='scarf_datasets')
time: 22.3 s (started: 2023-05-24 14:40:40 +00:00)
reader = scarf.CrDirReader('scarf_datasets/lecun_60K_mnist_images', 'rna')
writer = scarf.CrToZarr(
    reader,
    zarr_fn='scarf_datasets/lecun_60K_mnist_images/data.zarr',
    chunk_size=(2000, 1000),
)
writer.dump(batch_size=1000)
WARNING: feature_types extraction failed from features.tsv.gz in column 2
time: 6.33 s (started: 2023-05-24 14:41:03 +00:00)
2) Load the Zarr file into the DataStore object#
ds = scarf.DataStore(
    'scarf_datasets/lecun_60K_mnist_images/data.zarr',
    min_cells_per_feature=1000,
    min_features_per_cell=10,
    nthreads=4,
)
ds
WARNING: No matches found for pattern MT-|mt. Will not add/update percentage feature
WARNING: No matches found for pattern RPS|RPL|MRPS|MRPL. Will not add/update percentage feature
DataStore has 60000 (60000) cells with 1 assays: RNA
   Cell metadata:
            'I', 'ids', 'names', 'RNA_nCounts', 'RNA_nFeatures',

   RNA assay has 467 (784) features and following metadata:
            'I', 'ids', 'names', 'dropOuts', 'nCells',
time: 1.5 s (started: 2023-05-24 14:41:09 +00:00)
The labels for each image are embedded in their names. We will extract them add them as a separate column in cells attribute table
ds.cells.insert('digit_label',
                [int(x.rsplit('_', 1)[-1])-1 for x
                 in ds.cells.fetch_all('names')], overwrite=True)
WARNING: 'values' parameter is of `list` type and not `np.ndarray` as expected. The correct dtype may not be assigned to the column
time: 106 ms (started: 2023-05-24 14:41:11 +00:00)
3) Creating neighbourhood graph#
We will not perform any cell filtering here. We will also skip feature selection step and will use all the valid features. Since, we imported the data as an RNAassay, PCA will be performed on the data. Before we begin the graph creation step, we will turn off the default normlization for an RNAassay.
# Set normalization method to a dummy function that returns unnormalized data
ds.RNA.normMethod = scarf.assay.norm_dummy
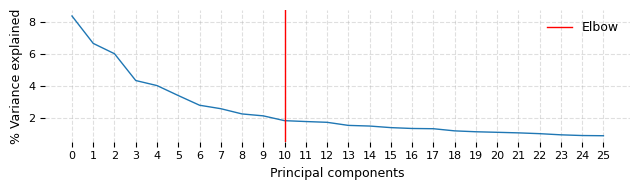
ds.make_graph(feat_key='I', k=31, dims=25, n_centroids=100, show_elbow_plot=True)
/home/docs/checkouts/readthedocs.org/user_builds/scarf/envs/0.23.5/lib/python3.8/site-packages/sklearn/cluster/_kmeans.py:870: FutureWarning: The default value of `n_init` will change from 3 to 'auto' in 1.4. Set the value of `n_init` explicitly to suppress the warning
  warnings.warn(
/home/docs/checkouts/readthedocs.org/user_builds/scarf/envs/0.23.5/lib/python3.8/site-packages/umap/distances.py:1063: NumbaDeprecationWarning: The 'nopython' keyword argument was not supplied to the 'numba.jit' decorator. The implicit default value for this argument is currently False, but it will be changed to True in Numba 0.59.0. See https://numba.readthedocs.io/en/stable/reference/deprecation.html#deprecation-of-object-mode-fall-back-behaviour-when-using-jit for details.
  @numba.jit()
/home/docs/checkouts/readthedocs.org/user_builds/scarf/envs/0.23.5/lib/python3.8/site-packages/umap/distances.py:1071: NumbaDeprecationWarning: The 'nopython' keyword argument was not supplied to the 'numba.jit' decorator. The implicit default value for this argument is currently False, but it will be changed to True in Numba 0.59.0. See https://numba.readthedocs.io/en/stable/reference/deprecation.html#deprecation-of-object-mode-fall-back-behaviour-when-using-jit for details.
  @numba.jit()
/home/docs/checkouts/readthedocs.org/user_builds/scarf/envs/0.23.5/lib/python3.8/site-packages/umap/distances.py:1086: NumbaDeprecationWarning: The 'nopython' keyword argument was not supplied to the 'numba.jit' decorator. The implicit default value for this argument is currently False, but it will be changed to True in Numba 0.59.0. See https://numba.readthedocs.io/en/stable/reference/deprecation.html#deprecation-of-object-mode-fall-back-behaviour-when-using-jit for details.
  @numba.jit()
/home/docs/checkouts/readthedocs.org/user_builds/scarf/envs/0.23.5/lib/python3.8/site-packages/umap/umap_.py:660: NumbaDeprecationWarning: The 'nopython' keyword argument was not supplied to the 'numba.jit' decorator. The implicit default value for this argument is currently False, but it will be changed to True in Numba 0.59.0. See https://numba.readthedocs.io/en/stable/reference/deprecation.html#deprecation-of-object-mode-fall-back-behaviour-when-using-jit for details.
  @numba.jit()
INFO: ANN recall: 100.00%
time: 1min 19s (started: 2023-05-24 14:41:11 +00:00)
The elbow plot above suggests that taking first 10 PC dimensions might have been optimal this dataset. We wanted to capture even the very fine difference (at risk of larger noise) between the digits and hence do not rerun this with dims=10
4) UMAP embedding and clustering#
We will now generate a 2D embedding of the neighbourhood graph of the MNIST images. This will allow to to ascertain visually, how accurate Scarf was in estimating the underlying manifold of this dataset. There are two critical differences between calling UMAP from with Scarf and directly from UMAP library:
When calling from Scarf, only the neighbourhood graph is provided to the core UMAP algorithm rather a normalized/scaled/reduced data matrix.
Scarf performs a Kmeans clustering while identifying neighbours, this allows Scarf to generate an informed initial embedding coordinates for the data based on the KMeans centroids. UMAP package, on the other hand, calculates spectral layout for the graph.
ds.run_umap(n_epochs=300, spread=1, min_dist=0.05, parallel=True)
time: 4min 55s (started: 2023-05-24 14:42:30 +00:00)
Before we visualize the UMAP embeddings, we will also perform clustering on the data (neighbourhood graph) using the default Paris algorithm. Here we choose to perform overclustering of the data so that we can capture fine differences within the individual digit classes.
ds.run_clustering(n_clusters=20)
time: 23.7 s (started: 2023-05-24 14:47:26 +00:00)
Relabeling the cluster ids to match their corresponding digit labels
ds.smart_label(
    to_relabel='RNA_cluster',
    base_label='digit_label',
    new_col_name='cluster_label',
)
---------------------------------------------------------------------------
ValueError                                Traceback (most recent call last)
Cell In[9], line 1
----> 1 ds.smart_label(
      2     to_relabel='RNA_cluster',
      3     base_label='digit_label',
      4     new_col_name='cluster_label',
      5 )

File ~/checkouts/readthedocs.org/user_builds/scarf/envs/0.23.5/lib/python3.8/site-packages/scarf/datastore/datastore.py:1040, in DataStore.smart_label(self, to_relabel, base_label, cell_key, new_col_name)
   1038         a = chr(ord("@") + n)
   1039         new_names[k] = f"{i}{a.lower()}"
-> 1040 miss_idxmax = df.loc[missing_vals].idxmax(axis=1).to_dict()
   1041 for k, v in miss_idxmax.items():
   1042     new_names[v] = f"{new_names[v][:-1]}-{k}{new_names[v][-1]}"

File ~/checkouts/readthedocs.org/user_builds/scarf/envs/0.23.5/lib/python3.8/site-packages/pandas/core/frame.py:10640, in DataFrame.idxmax(self, axis, skipna, numeric_only)
  10637 else:
  10638     data = self
> 10640 res = data._reduce(
  10641     nanops.nanargmax, "argmax", axis=axis, skipna=skipna, numeric_only=False
  10642 )
  10643 indices = res._values
  10645 # indices will always be np.ndarray since axis is not None and
  10646 # values is a 2d array for DataFrame
  10647 # error: Item "int" of "Union[int, Any]" has no attribute "__iter__"

File ~/checkouts/readthedocs.org/user_builds/scarf/envs/0.23.5/lib/python3.8/site-packages/pandas/core/frame.py:10509, in DataFrame._reduce(self, op, name, axis, skipna, numeric_only, filter_type, **kwds)
  10504 elif axis == 1:
  10505     if len(df.index) == 0:
  10506         # Taking a transpose would result in no columns, losing the dtype.
  10507         # In the empty case, reducing along axis 0 or 1 gives the same
  10508         # result dtype, so reduce with axis=0 and ignore values
> 10509         result = df._reduce(
  10510             op,
  10511             name,
  10512             axis=0,
  10513             skipna=skipna,
  10514             numeric_only=False,
  10515             filter_type=filter_type,
  10516             **kwds,
  10517         ).iloc[:0]
  10518         result.index = df.index
  10519         return result

File ~/checkouts/readthedocs.org/user_builds/scarf/envs/0.23.5/lib/python3.8/site-packages/pandas/core/frame.py:10524, in DataFrame._reduce(self, op, name, axis, skipna, numeric_only, filter_type, **kwds)
  10520     df = df.T
  10522 # After possibly _get_data and transposing, we are now in the
  10523 #  simple case where we can use BlockManager.reduce
> 10524 res = df._mgr.reduce(blk_func)
  10525 out = df._constructor(res).iloc[0]
  10526 if out_dtype is not None:

File ~/checkouts/readthedocs.org/user_builds/scarf/envs/0.23.5/lib/python3.8/site-packages/pandas/core/internals/managers.py:1534, in BlockManager.reduce(self, func)
   1532 res_blocks: list[Block] = []
   1533 for blk in self.blocks:
-> 1534     nbs = blk.reduce(func)
   1535     res_blocks.extend(nbs)
   1537 index = Index([None])  # placeholder

File ~/checkouts/readthedocs.org/user_builds/scarf/envs/0.23.5/lib/python3.8/site-packages/pandas/core/internals/blocks.py:339, in Block.reduce(self, func)
    333 @final
    334 def reduce(self, func) -> list[Block]:
    335     # We will apply the function and reshape the result into a single-row
    336     #  Block with the same mgr_locs; squeezing will be done at a higher level
    337     assert self.ndim == 2
--> 339     result = func(self.values)
    341     if self.values.ndim == 1:
    342         # TODO(EA2D): special case not needed with 2D EAs
    343         res_values = np.array([[result]])

File ~/checkouts/readthedocs.org/user_builds/scarf/envs/0.23.5/lib/python3.8/site-packages/pandas/core/frame.py:10487, in DataFrame._reduce.<locals>.blk_func(values, axis)
  10485     return values._reduce(name, skipna=skipna, **kwds)
  10486 else:
> 10487     return op(values, axis=axis, skipna=skipna, **kwds)

File ~/checkouts/readthedocs.org/user_builds/scarf/envs/0.23.5/lib/python3.8/site-packages/pandas/core/nanops.py:96, in disallow.__call__.<locals>._f(*args, **kwargs)
     94 try:
     95     with np.errstate(invalid="ignore"):
---> 96         return f(*args, **kwargs)
     97 except ValueError as e:
     98     # we want to transform an object array
     99     # ValueError message to the more typical TypeError
    100     # e.g. this is normally a disallowed function on
    101     # object arrays that contain strings
    102     if is_object_dtype(args[0]):

File ~/checkouts/readthedocs.org/user_builds/scarf/envs/0.23.5/lib/python3.8/site-packages/pandas/core/nanops.py:1147, in nanargmax(values, axis, skipna, mask)
   1145 values, mask, _, _, _ = _get_values(values, True, fill_value_typ="-inf", mask=mask)
   1146 # error: Need type annotation for 'result'
-> 1147 result = values.argmax(axis)  # type: ignore[var-annotated]
   1148 result = _maybe_arg_null_out(result, axis, mask, skipna)
   1149 return result

ValueError: attempt to get argmax of an empty sequence
time: 3.64 s (started: 2023-05-24 14:47:50 +00:00)
ds.plot_layout(
    layout_key='RNA_UMAP', color_by=['digit_label', 'cluster_label'],
    do_shading=True, shade_npixels=300, legend_onside=False,
    width=4, height=4, cmap='tab20'
)
WARNING: 1 values were not found in the table column names
---------------------------------------------------------------------------
ValueError                                Traceback (most recent call last)
Cell In[10], line 1
----> 1 ds.plot_layout(
      2     layout_key='RNA_UMAP', color_by=['digit_label', 'cluster_label'],
      3     do_shading=True, shade_npixels=300, legend_onside=False,
      4     width=4, height=4, cmap='tab20'
      5 )

File ~/checkouts/readthedocs.org/user_builds/scarf/envs/0.23.5/lib/python3.8/site-packages/scarf/datastore/datastore.py:1346, in DataStore.plot_layout(self, from_assay, cell_key, layout_key, color_by, subselection_key, size_vals, clip_fraction, width, height, default_color, cmap, color_key, mask_values, mask_name, mask_color, point_size, do_shading, shade_npixels, shade_min_alpha, spread_pixels, spread_threshold, ax_label_size, frame_offset, spine_width, spine_color, displayed_sides, legend_ondata, legend_onside, legend_size, legends_per_col, title, title_size, hide_title, cbar_shrink, marker_scale, lspacing, cspacing, shuffle_df, sort_values, savename, save_dpi, ax, force_ints_as_cats, n_columns, w_pad, h_pad, show_fig, scatter_kwargs)
   1344     v = np.ones(len(x)).astype(int)
   1345 else:
-> 1346     v = self.get_cell_vals(
   1347         from_assay=from_assay,
   1348         cell_key=cell_key,
   1349         k=c,
   1350         clip_fraction=clip_fraction,
   1351     )
   1352 df = pd.DataFrame({f"{lk} 1": x, f"{lk} 2": y, c: v})
   1353 if size_vals is not None:

File ~/checkouts/readthedocs.org/user_builds/scarf/envs/0.23.5/lib/python3.8/site-packages/scarf/datastore/base_datastore.py:441, in BaseDataStore.get_cell_vals(self, from_assay, cell_key, k, clip_fraction, use_precached)
    439 feat_idx = assay.feats.get_index_by([k], "names")
    440 if len(feat_idx) == 0:
--> 441     raise ValueError(f"ERROR: {k} not found in {from_assay} assay.")
    442 else:
    443     if len(feat_idx) > 1:

ValueError: ERROR: cluster_label not found in RNA assay.
time: 239 ms (started: 2023-05-24 14:47:53 +00:00)
The UMAP embedding shows that images from the same individual digit classes were grouped together very nicely. We obtained a cluster of digits classes 4,7 and 9 and another of 3, 5 and 8 classses, similar observation has been made before in the link below. Since, the images from classes 0 and 1 are well separated once can infer that the global structure is also well preserved.
https://umap-learn.readthedocs.io/en/latest/auto_examples/plot_mnist_example.html
We can use plot_cluster_tree method to show an explicit realtionship between the clusters of images. This method leverages the hierarchical relationship between the individual images as calculated by the Paris algorithm. Each circle/pie (sized by number of images in the cluster) represents a clusters. The colurs inside each pie indicate the proportion actual digit classes.
ds.plot_cluster_tree(
    cluster_key='cluster_label',
    fill_by_value='digit_label',
)
---------------------------------------------------------------------------
KeyError                                  Traceback (most recent call last)
Cell In[11], line 1
----> 1 ds.plot_cluster_tree(
      2     cluster_key='cluster_label',
      3     fill_by_value='digit_label',
      4 )

File ~/checkouts/readthedocs.org/user_builds/scarf/envs/0.23.5/lib/python3.8/site-packages/scarf/datastore/datastore.py:1562, in DataStore.plot_cluster_tree(self, from_assay, cell_key, feat_key, cluster_key, fill_by_value, force_ints_as_cats, width, lvr_factor, vert_gap, min_node_size, node_size_multiplier, node_power, root_size, non_leaf_size, show_labels, fontsize, root_color, non_leaf_color, cmap, color_key, edgecolors, edgewidth, alpha, figsize, ax, show_fig, savename, save_dpi)
   1558 if cluster_key is None:
   1559     raise ValueError(
   1560         "ERROR: Please provide a value for `cluster_key` parameter"
   1561     )
-> 1562 clusts = self.cells.fetch(cluster_key, key=cell_key)
   1563 graph_loc = self._get_latest_graph_loc(from_assay, cell_key, feat_key)
   1564 dendrogram_loc = self.z[graph_loc].attrs["latest_dendrogram"]

File ~/checkouts/readthedocs.org/user_builds/scarf/envs/0.23.5/lib/python3.8/site-packages/scarf/metadata.py:252, in MetaData.fetch(self, column, key)
    242 def fetch(self, column: str, key: str = "I") -> np.ndarray:
    243     """Get column values for only valid rows.
    244
    245     Args:
   (...)
    249     Returns:
    250     """
--> 252     return self.fetch_all(column)[self.active_index(key)]

File ~/checkouts/readthedocs.org/user_builds/scarf/envs/0.23.5/lib/python3.8/site-packages/scarf/metadata.py:224, in MetaData.fetch_all(self, column)
    215 def fetch_all(self, column: str) -> np.ndarray:
    216     """
    217
    218     Args:
   (...)
    222
    223     """
--> 224     return self._get_array(column)[:]

File ~/checkouts/readthedocs.org/user_builds/scarf/envs/0.23.5/lib/python3.8/site-packages/scarf/metadata.py:134, in MetaData._get_array(self, column)
    125 def _get_array(self, column: str) -> zarr_array:
    126     """
    127
    128     Args:
   (...)
    132
    133     """
--> 134     loc, col = self._get_loc(column)
    135     return self.locations[loc][col]

File ~/checkouts/readthedocs.org/user_builds/scarf/envs/0.23.5/lib/python3.8/site-packages/scarf/metadata.py:121, in MetaData._get_loc(self, column)
    119 col_map = self._column_map()
    120 if column not in col_map:
--> 121     raise KeyError(f"{column} does not exist in the metadata columns.")
    122 loc, col = col_map[column]
    123 return loc, col

KeyError: 'cluster_label does not exist in the metadata columns.'
time: 410 ms (started: 2023-05-24 14:47:54 +00:00)
Finally, lets visualize images from each of the cluster. To do so, we take all images from a given cluster and merge them (think of it can creating an overlay of all the images from that cluster).
clusts = pd.Series(ds.cells.fetch_all('cluster_label'))
digits = pd.Series(ds.cells.fetch_all('digit_label'))
---------------------------------------------------------------------------
KeyError                                  Traceback (most recent call last)
Cell In[12], line 1
----> 1 clusts = pd.Series(ds.cells.fetch_all('cluster_label'))
      2 digits = pd.Series(ds.cells.fetch_all('digit_label'))

File ~/checkouts/readthedocs.org/user_builds/scarf/envs/0.23.5/lib/python3.8/site-packages/scarf/metadata.py:224, in MetaData.fetch_all(self, column)
    215 def fetch_all(self, column: str) -> np.ndarray:
    216     """
    217
    218     Args:
   (...)
    222
    223     """
--> 224     return self._get_array(column)[:]

File ~/checkouts/readthedocs.org/user_builds/scarf/envs/0.23.5/lib/python3.8/site-packages/scarf/metadata.py:134, in MetaData._get_array(self, column)
    125 def _get_array(self, column: str) -> zarr_array:
    126     """
    127
    128     Args:
   (...)
    132
    133     """
--> 134     loc, col = self._get_loc(column)
    135     return self.locations[loc][col]

File ~/checkouts/readthedocs.org/user_builds/scarf/envs/0.23.5/lib/python3.8/site-packages/scarf/metadata.py:121, in MetaData._get_loc(self, column)
    119 col_map = self._column_map()
    120 if column not in col_map:
--> 121     raise KeyError(f"{column} does not exist in the metadata columns.")
    122 loc, col = col_map[column]
    123 return loc, col

KeyError: 'cluster_label does not exist in the metadata columns.'
time: 76.7 ms (started: 2023-05-24 14:47:54 +00:00)
fig = plt.figure(figsize=(8,2))
for n,i in enumerate(sorted(clusts.unique())):
    mean_map = ds.RNA.rawData[((clusts == i) & (digits == int(i[0]))).values].mean(axis=0)
    mean_map = mean_map.compute().reshape(28, 28)
    ax = fig.add_subplot(2, 10, n+1)
    ax.imshow(mean_map, cmap='binary')
    ax.set_axis_off()
    ax.set_title(i, fontsize=10)
plt.tight_layout()
plt.show()
---------------------------------------------------------------------------
NameError                                 Traceback (most recent call last)
Cell In[13], line 2
      1 fig = plt.figure(figsize=(8,2))
----> 2 for n,i in enumerate(sorted(clusts.unique())):
      3     mean_map = ds.RNA.rawData[((clusts == i) & (digits == int(i[0]))).values].mean(axis=0)
      4     mean_map = mean_map.compute().reshape(28, 28)

NameError: name 'clusts' is not defined
<Figure size 800x200 with 0 Axes>
time: 53.5 ms (started: 2023-05-24 14:47:54 +00:00)
It is quite clear that Scarf’s clsutering was able to identify naunced differences between the images. For example, cluster 1a and 1c captured those images of an ‘upright’ 1s while cluster 1b and 1d captured ‘slanted’ 1s.
This vignette helped us learn two things:
Scarf is a flexible package that can handle analysis of diverse kinds of datasets.
Results from this dataset show that Scarf can perform quick, memory efficient and meaningful analysis of large-scale datasets.
That is all for this vignette.